Over 15,000 earthquakes are recorded in New Zealand every year, earning NZ the nickname, ‘The Shaky Isles’. But of those quakes, only about 100–150 are large enough that we feel them — the rest are detected by seismographs.
For most Kiwis, accessing and interacting with this growing set of earthquake data in an engaging way has been a challenge.
In 2019, Museum of New Zealand Te Papa Tongarewa (Te Papa) revamped their nature exhibitions after 21 years of educating visitors about New Zealand’s unique flora, fauna, and geography. They asked us to design and build a data-driven digital experience for the new Whakarūaumoko Active Land exhibition in the Te Taiao Nature zone.
The result was Quake Nation. It’s a large interactive touchscreen that helps museum-goers discover that earthquakes aren’t one-off events, but spikes in a never-ending sequence of tremors.
Our Approach Prototyping our ideas with real data
In close collaboration with GNS Science, we built upon Te Papa’s initial concept, design and audience research.
Our team carried out in-depth prototyping using the rich and extensive GeoNet earthquake data set from the beginning of the design process. We explored many different ways of presenting the data, as well as trying out fun and intuitive ways of interacting with it.
We used drawings of screen designs to test our early ideas with Te Papa staff and find out what worked, and what could make the experience better.
Bringing NZ’s quake history to life
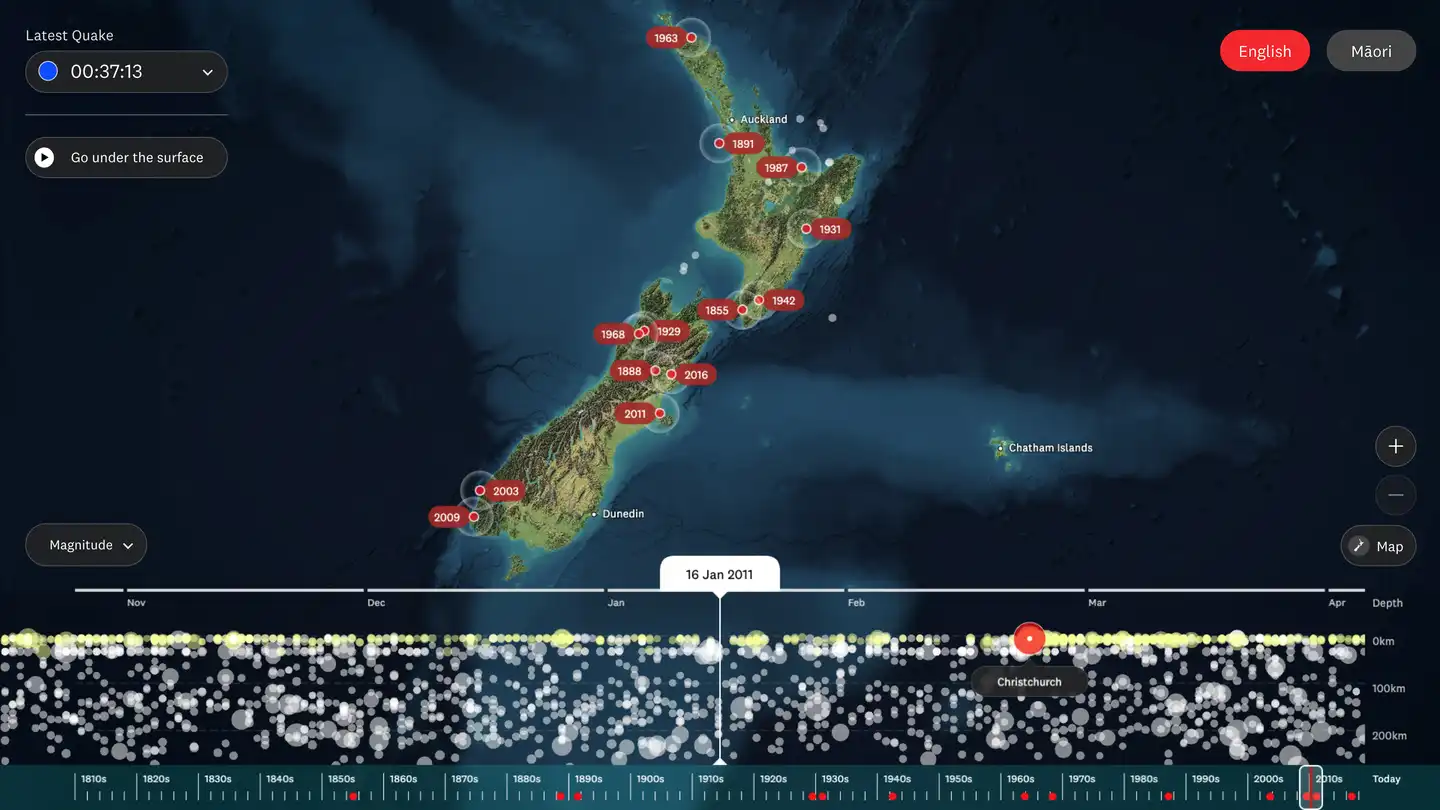
Quake Nation’s large touchscreen displays a colourised topographical map of NZ above a scrollable timeline of earthquakes.
Presenting over 200 years of seismic data
We tested many different timeline layouts — including vertical, horizontal, a wheel, and even a zoomable version. We went through many iterations to un-pick tricky questions like, ‘how many pixels wide is a year? How long is a day?’
In the end, we went for something simple. We present one entire year on-screen horizontally, and a marker in the middle tells you the date of the earthquake that’s displayed.
The scrollable timeline lets users explore the entire GeoNet earthquake dataset back to 1810. But it’s not just historical data. The GeoNet API feeds in live data every few minutes and alerts users when the latest earthquake above a specific magnitude is detected.
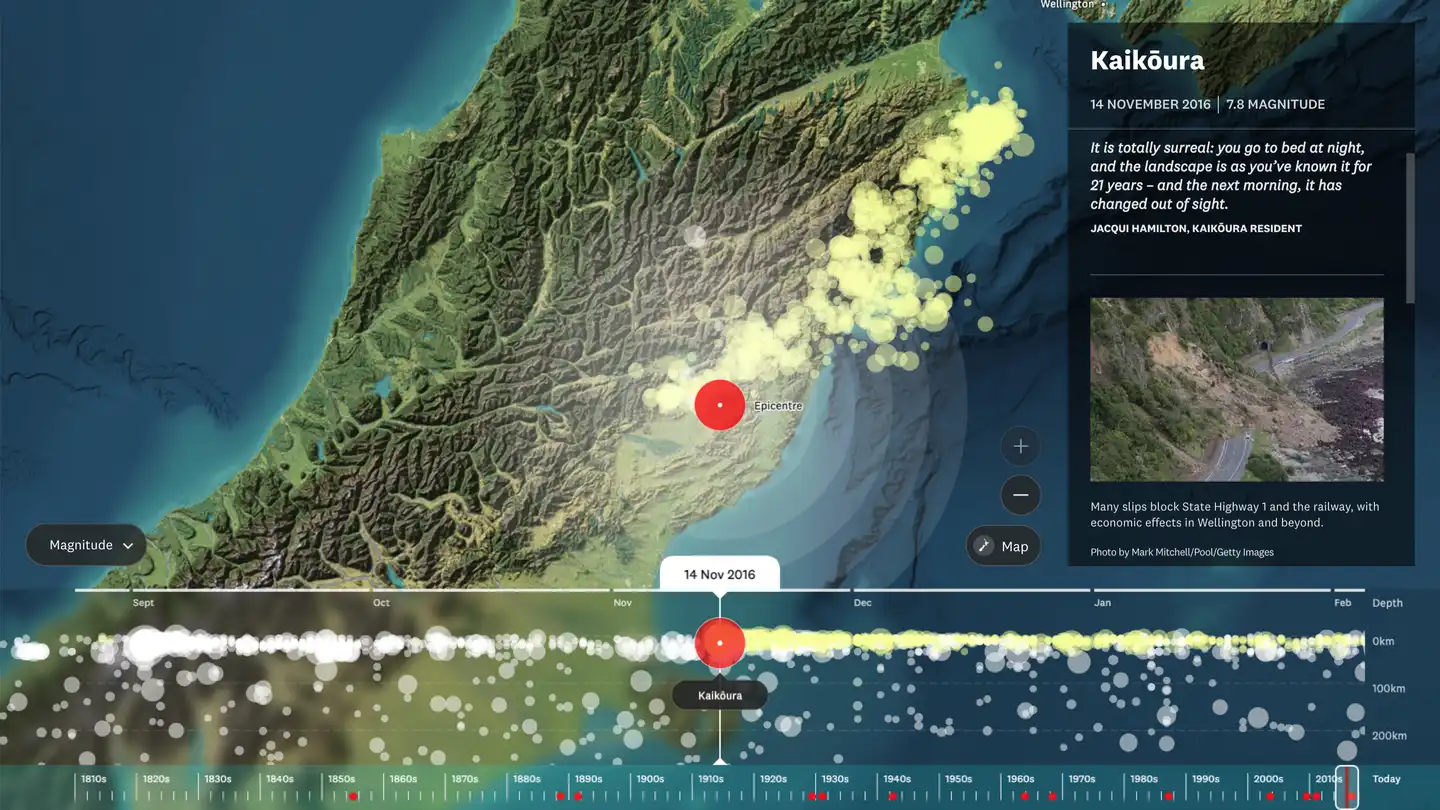
Each earthquake is represented by a white bubble on the timeline. The bubble’s vertical position shows epicentre depth up to 200km, and the horizontal shows the date. The magnitude is represented by the size of the bubble — the bigger the bubble, the stronger the quake.
And since the exhibition was opened we’ve made further refinements. We tweaked the timeline to make it easier to scroll through multiple years at a time, so you can skip effortlessly from 1810 to today.
Mapping NZ’s land and seascapes
The map displays earthquake location and magnitude across NZ. Earthquakes ‘bubble up’ on the map as users scroll the timeline. Clusters of bubbles indicate multiple earthquakes, making it easy to see NZ’s most seismically active fault lines.
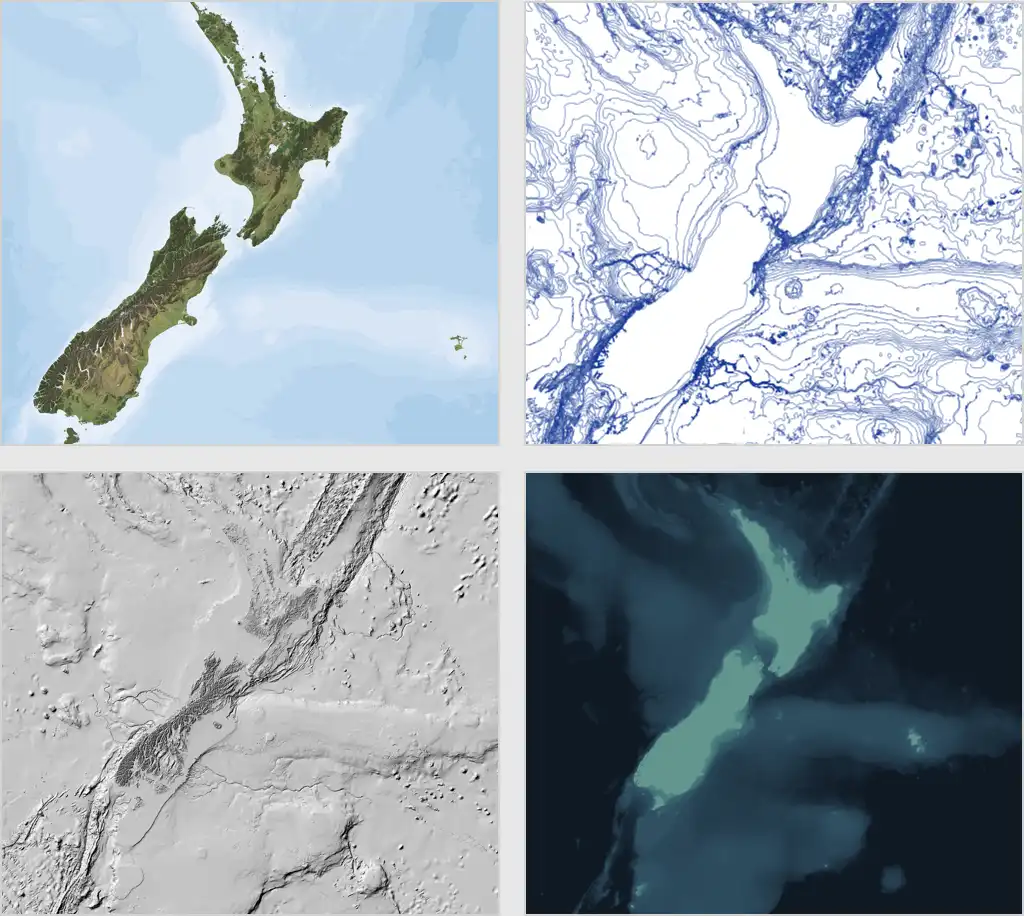
We sourced topographical data from cartography studio Geographx, and seafloor data from Crown Research Institute NIWA. The NIWA seafloor map was re-coloured to look more like a satellite image while still allowing users to see terrain and fault lines.
We composited multiple different map data sources and transformed them into a single topographic projection using the geo-spatial software, GDAL (Geospatial Data Abstraction Library). The end result is a visually rich, but geospatially correct, layered rendering of NZ.
A platform purpose-built for accessible digital experiences
We built Quake Nation on Te Papa’s Te Papahiko platform and Design Language System. These technologies empowered us to create a user experience that was consistent with Te Papa’s growing number of digital interactives.
Designing for all
We designed Quake Nation’s user interface to be fully accessible. Text and interactive elements use contrasting colours to make the information easier to see by people with colour blindness or visual impairment. The screen’s height and viewing angle is designed for kids, and people who might be interacting with it from a wheelchair or mobility scooter.
Quake Nation meets NZ Government Web Accessibility Standards, and is bilingual in te reo Māori and English.
of
Everyone gets a go
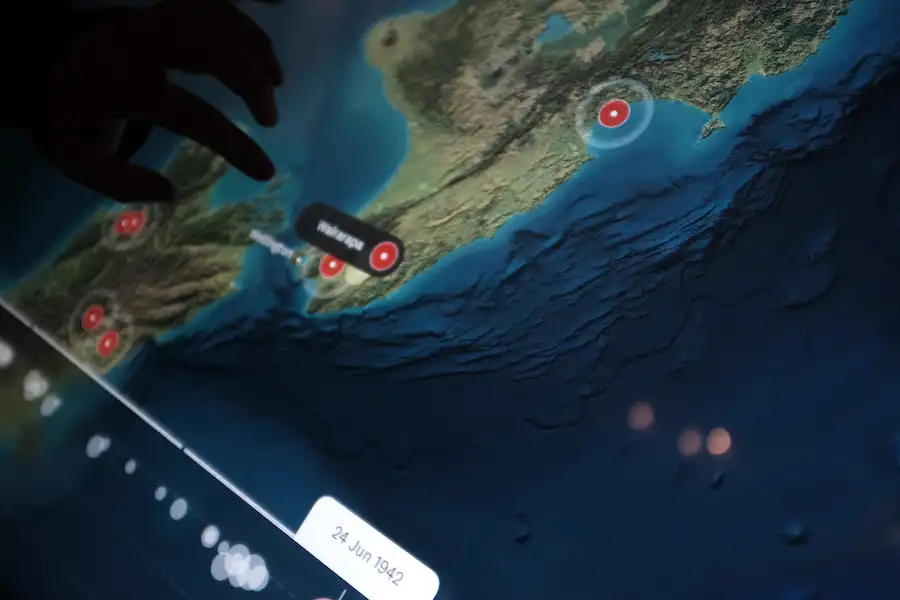
Visitors to Te Papa are often with groups of friends, family members, classmates or tourists. That’s why we needed to figure out how multiple users can make multiple touch gestures at the same time. For example, what happens when someone tries scrolling the timeline while someone else was panning across the map?
We designed Quake Nation to support interaction patterns familiar to anyone with a smartphone — users can pinch to zoom and drag to focus on areas of interest. And do it all at the same time.
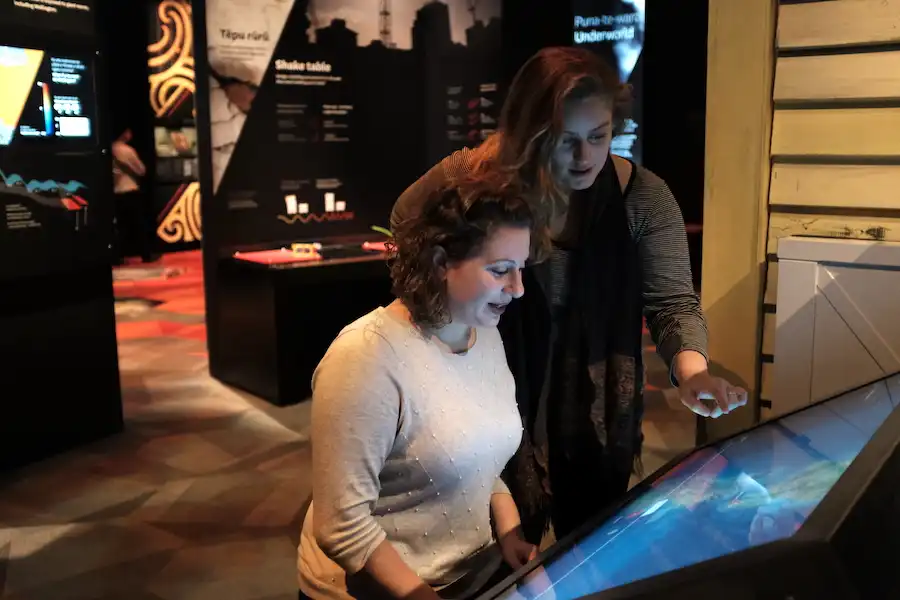
In our observational research of visitor use of the interactive, we observed that of the visitors who came within proximity of Quake Nation, over 40% engage. This is an excellent conversion rate for a touchscreen interactive in an exhibition of this kind.
Te Papa
The result Delivering a delightful data visualisation
Since Quake Nation was installed, observational research has found about half of the visitors to the Whakarūaumoko Active Land exhibition have interacted with it. And on average, two or more visitors interact with it each session — which generally lasts over 2 minutes.
This excellent level of engagement suggests people are using Quake Nation for the purpose it was designed — to deepen their knowledge of NZ’s earthquakes, in a learning experience shared with others.
Previous
Ministry of EducationNext
BRANZ