In 2020 we ran our second diversity and inclusion survey. We built on our learnings from the first survey and gave careful consideration to the way we asked the questions and how that might shape the data we received.
We also expanded our survey to include questions on inclusion as well as diversity, so we could better understand where we can do more to ensure our team feels valued as part of the whānau.
In this blog we’ll share our 2020 D&I results, and provide updates on goals we set last year in our blog on using data to shape diversity and inclusion goals.
Our 2020 Diversity and Inclusion results
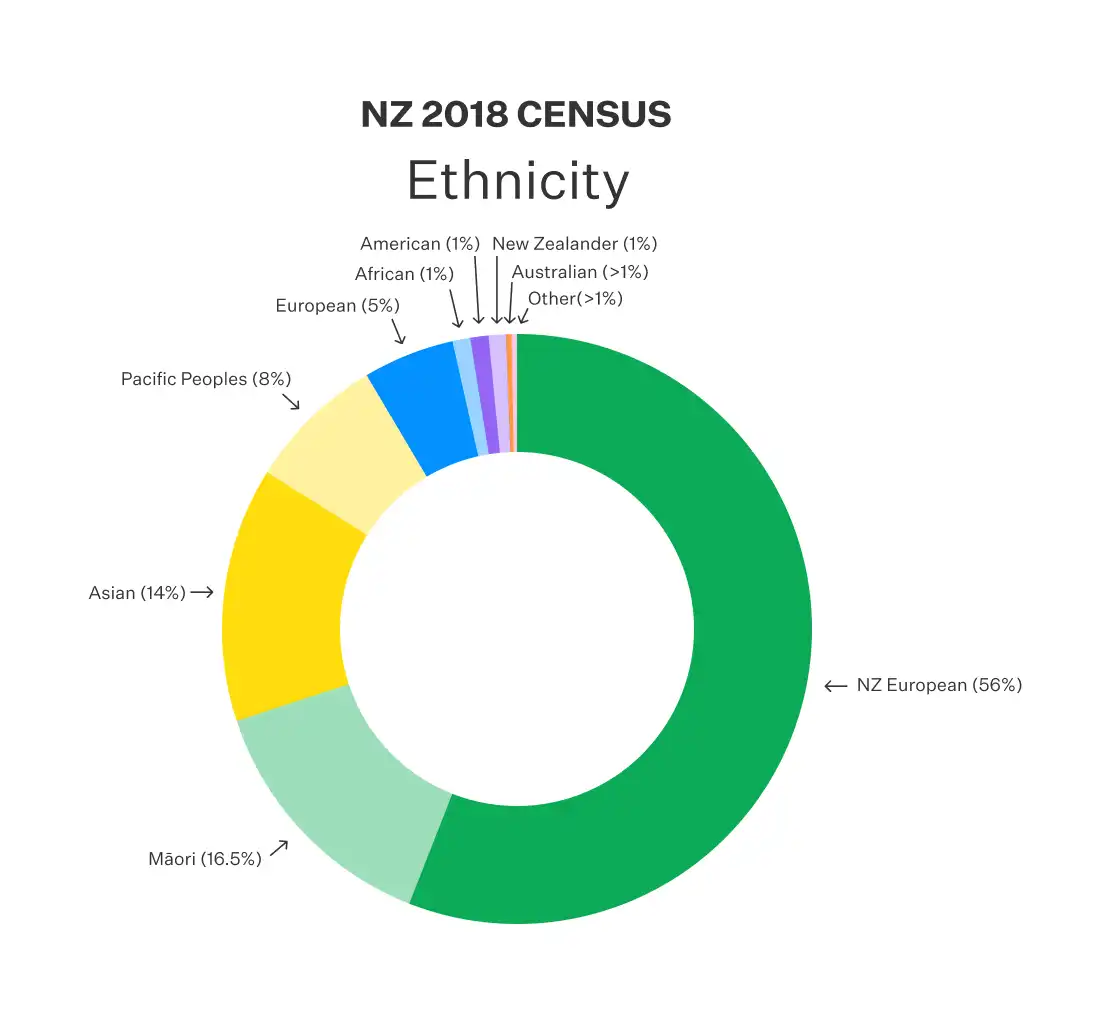
Below you’ll see our 2020 D&I survey results against our 2019 results and the 2018 New Zealand census data. The data collected by Stats NZ differs slightly from ours, so it’s not a direct comparison.
We use Stats NZ data to help us understand how representative Springload is of Aotearoa, however we acknowledge this 2018 data doesn't capture New Zealanders fully. We hope the 2023 NZ census offers more options for self identification in areas such as gender and sexual orientation, so we have a more accurate picture of Aotearoa and therefore more accurate data.
Ethnicity
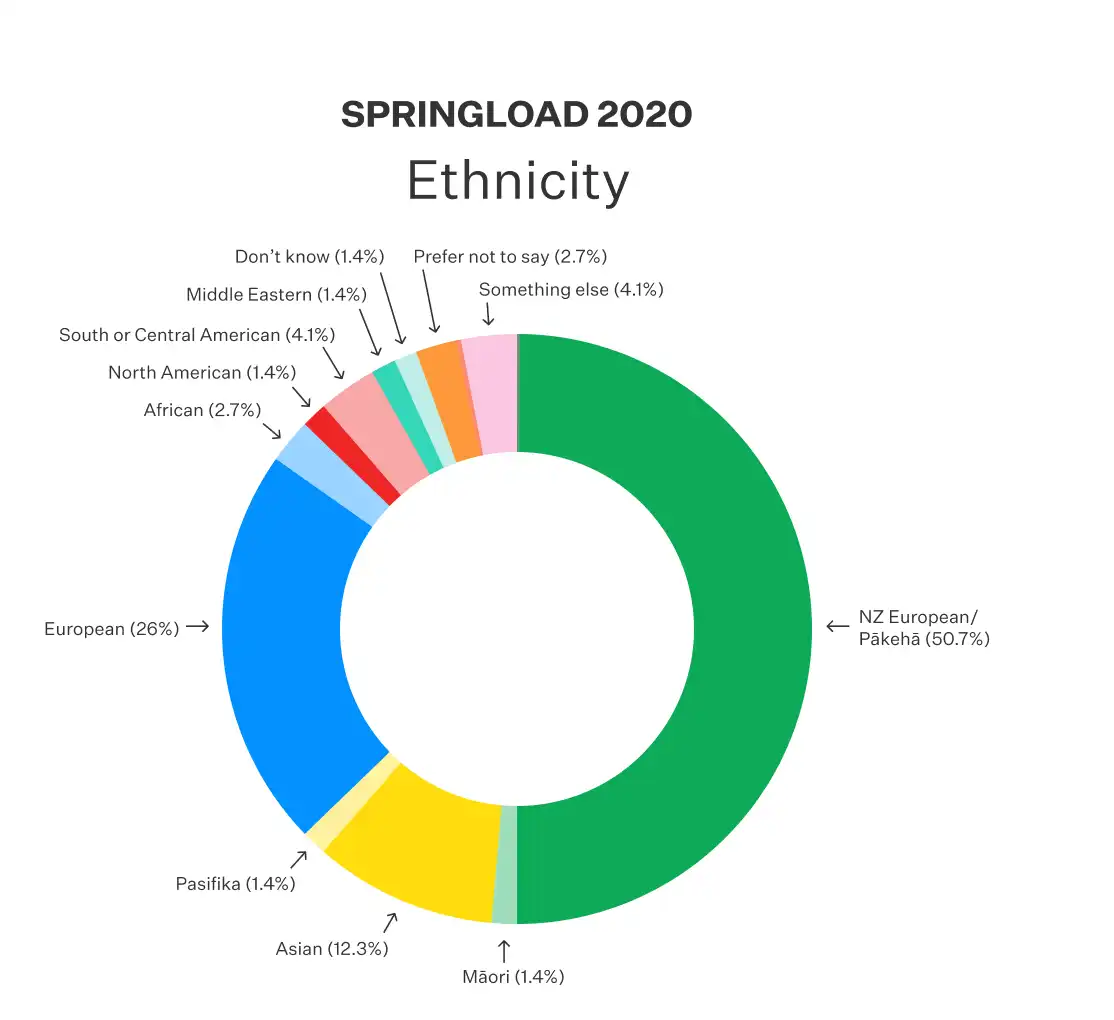
After our 2019 survey, our team told us they wanted more ethnicity options. By adding five extra options, we captured 1.4% North American, 4.1% South or Central American, 1.4% Middle Eastern, 1.4% don’t know, and 4.1% something else that makes up Springload.
In 2019 we had 1.5% Māori and 0% Pasifika. Last year, this shifted to 1.4% Māori and 1.4% Pasifika. This means we still have 15% less Māori and Pasifika representation than in the 2018 New Zealand census.
An ongoing goal for us is actively reaching out into Māori and Pasifika communities and schools and ensuring that what we can offer as an employer is desirable and culturally affirming for these communities.
Gender
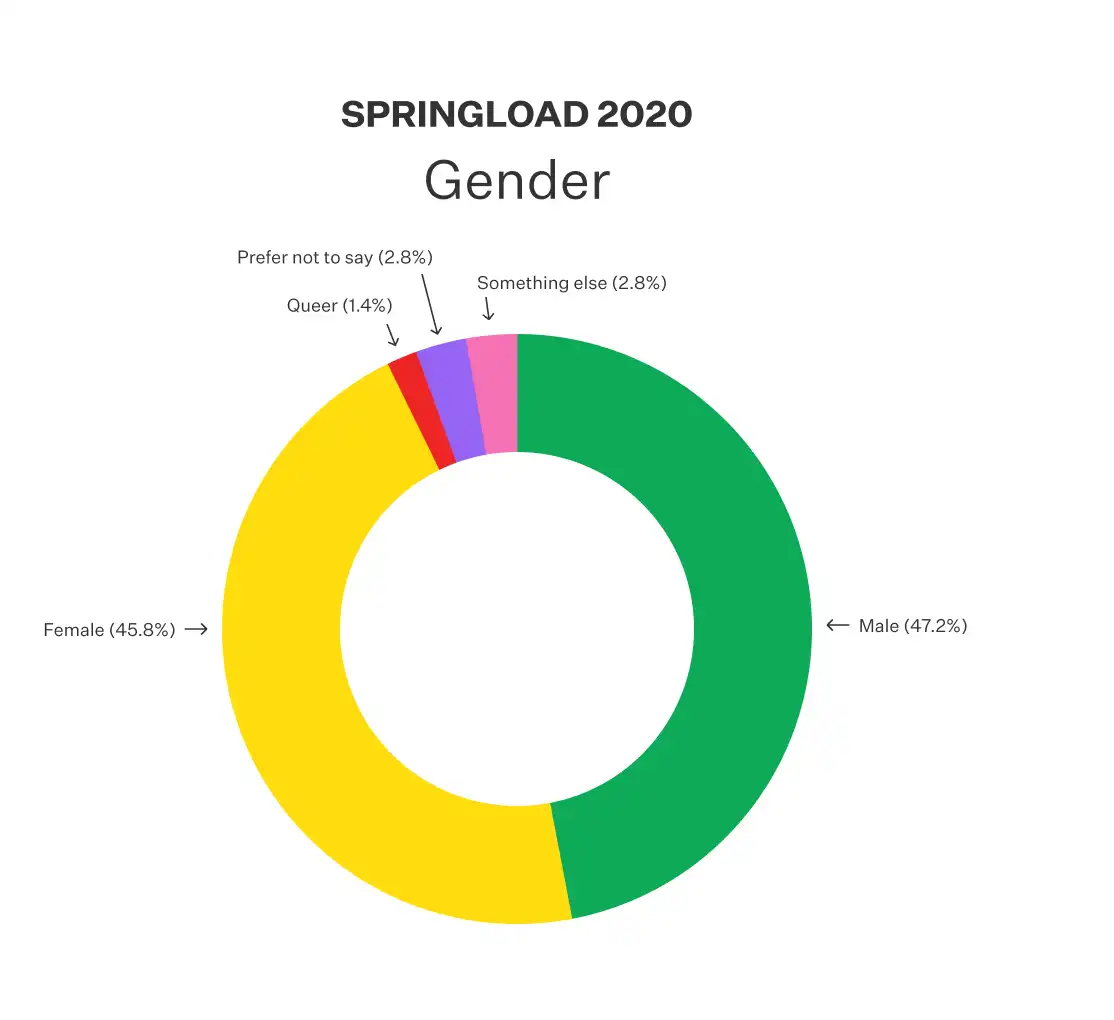
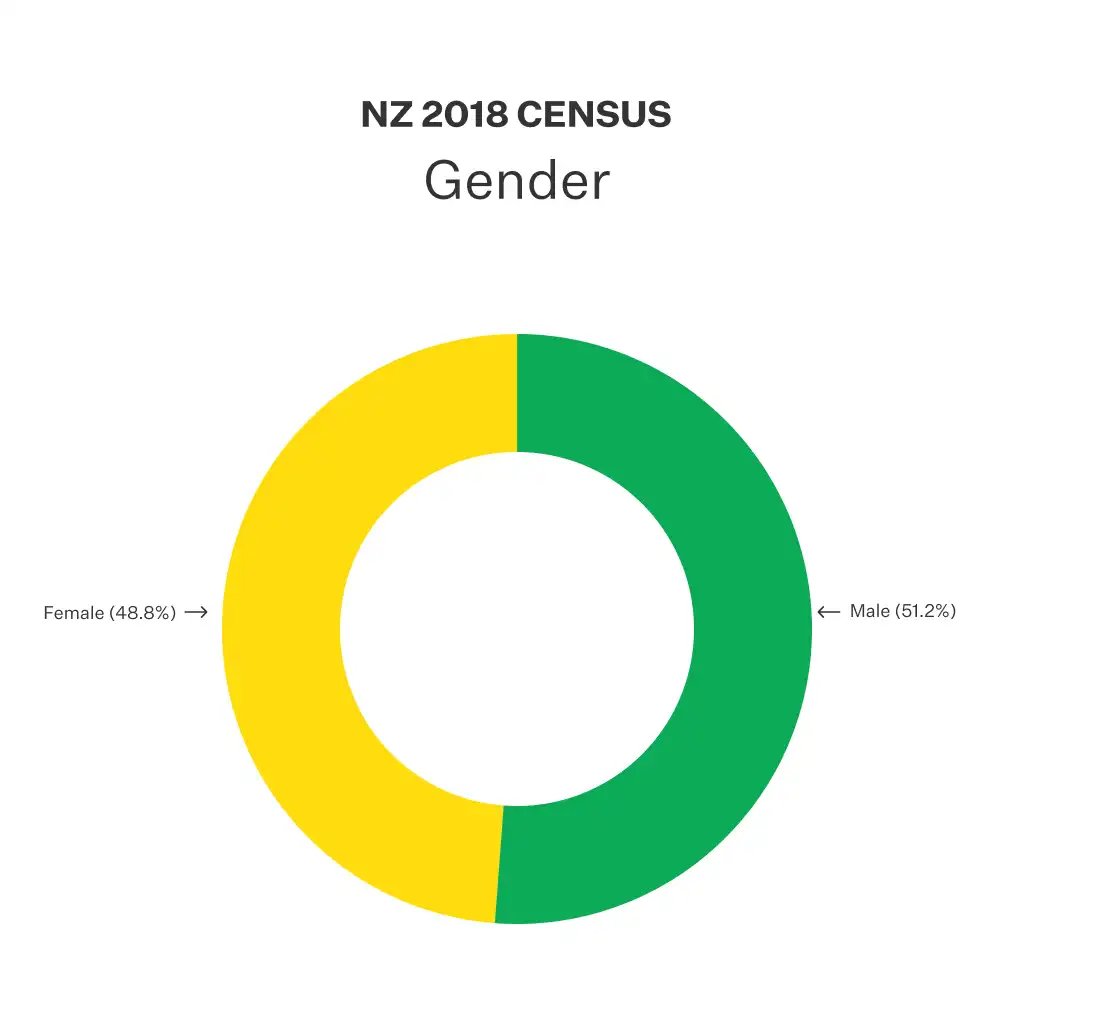
Women at Springload have increased by nearly 10% since our last survey, making our gender split more representative of Aotearoa. Our whānau is now made up of 45.8% women, 47.2% male, 1.4% queer, 2.8% something else, or 2.8% would prefer not to say.
We added intersex, transgender, queer, don’t know, and something else to our gender question so we could accurately capture how Springloaders self identify. This is the biggest addition in options between our 2019 and 2020 surveys, reflecting our changing attitudes and awareness around gender. A total of 7% of Springload identify outside of male or female, which was not an option in the 2018 census.
Sexual Orientation
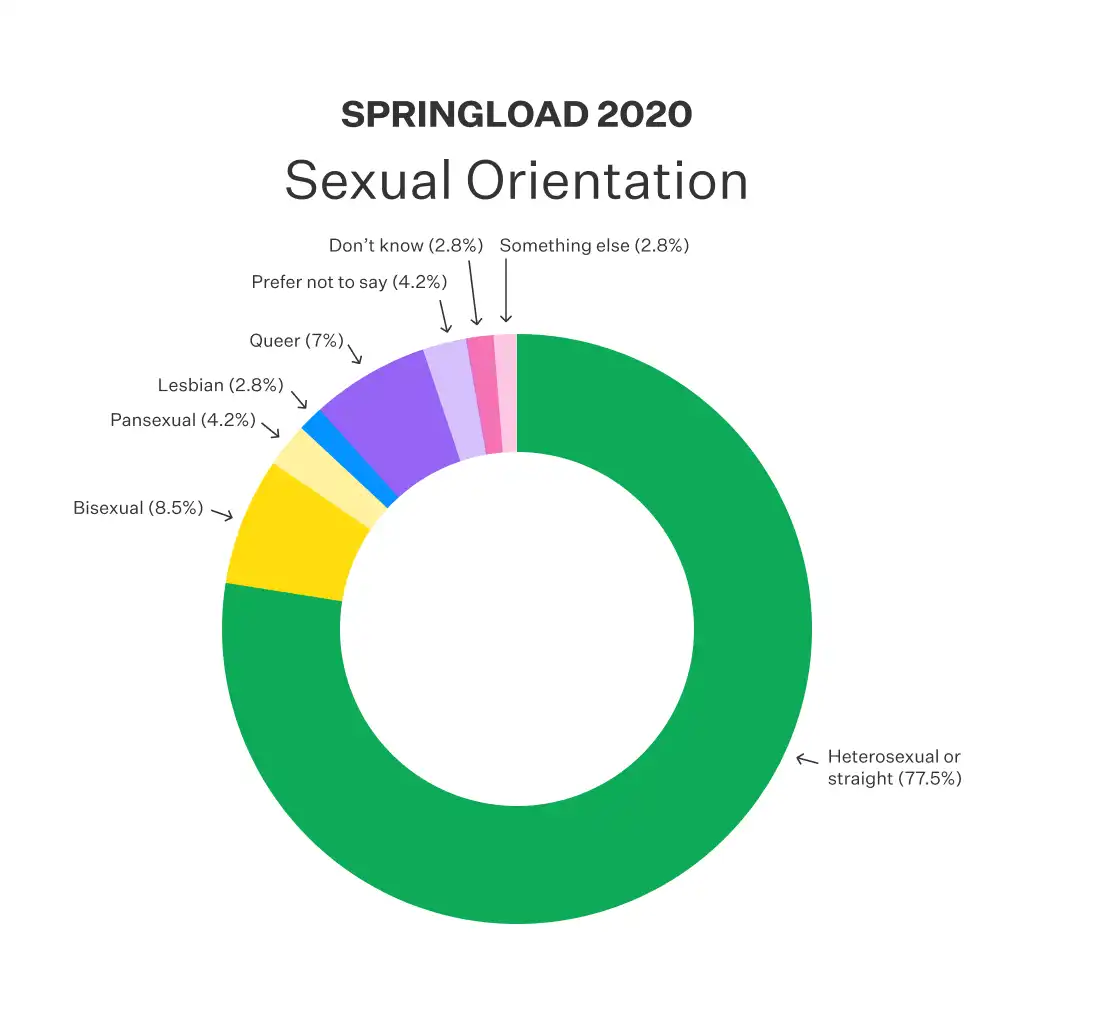
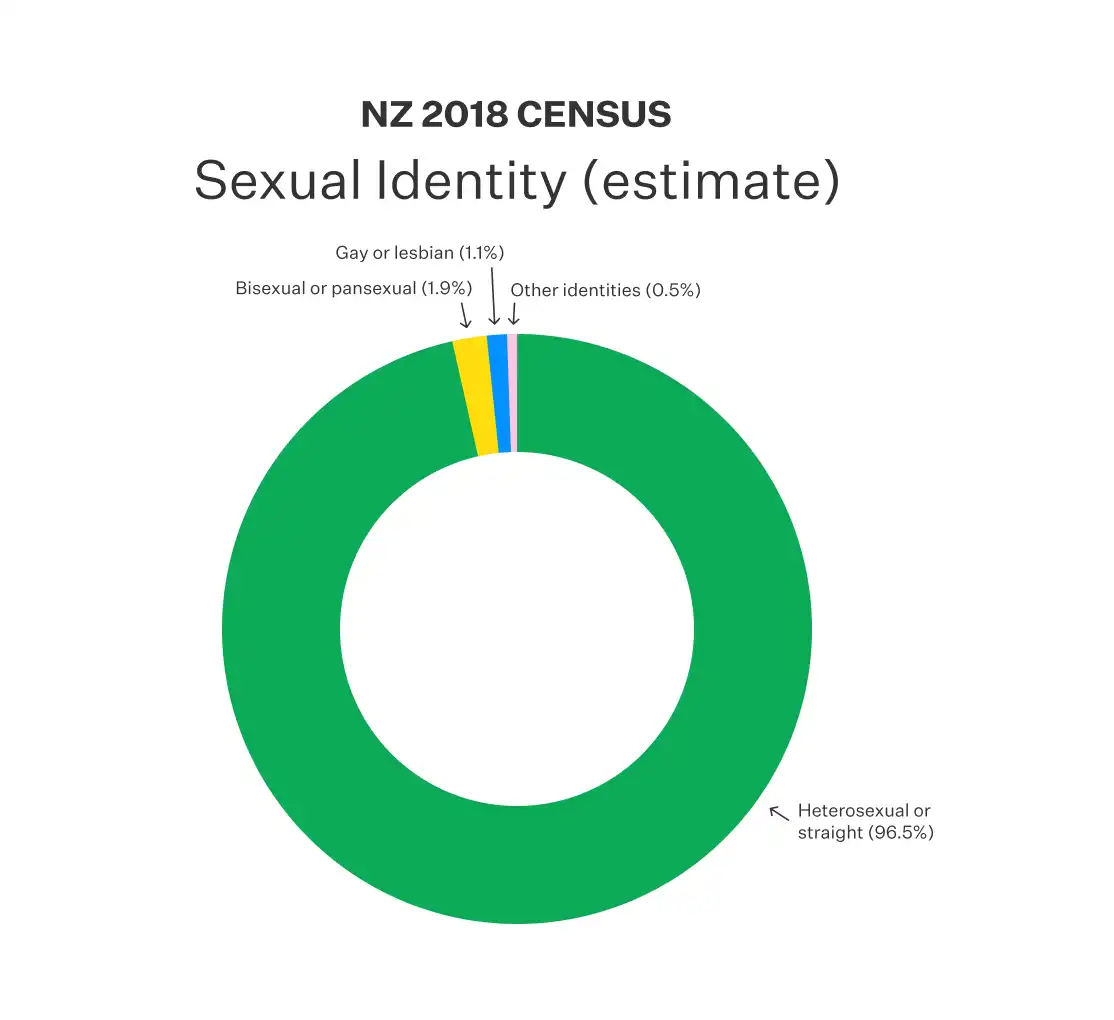
In our 2020 survey, 77.5% of Springloaders identified as heterosexual, 8.5% as bisexual, 7% as queer, 4.2% as pansexual and 2.8% as lesbian. In the 2018 New Zealand Social Survey 96.5% of people identified as heterosexual, 1.% as bisexual or pansexual and 1.1% as gay or lesbian.
Springload has a higher proportion of people identifying as something other than heterosexual/straight than the population of Aotearoa. However, the New Zealand Social Survey data was gathered via door to door interviews and therefore is less reliable than the anonymous data gathered via the official Census. They also offered fewer categories for people to identify with so it is hard to do a true comparison.
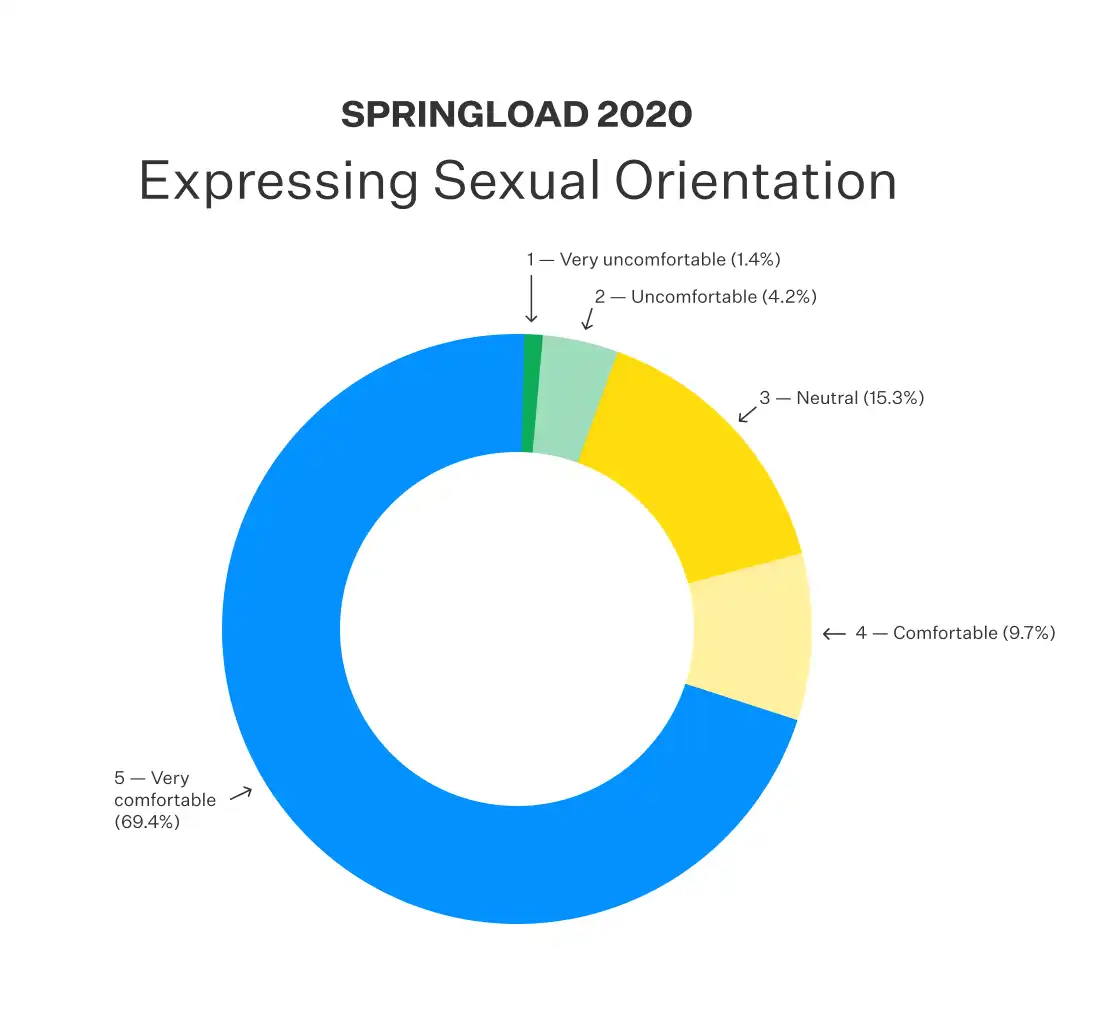
Asking inclusive questions
This year we added questions to try and capture how inclusive our culture is:
- How comfortable do you feel expressing your sexual orientation at Springload?
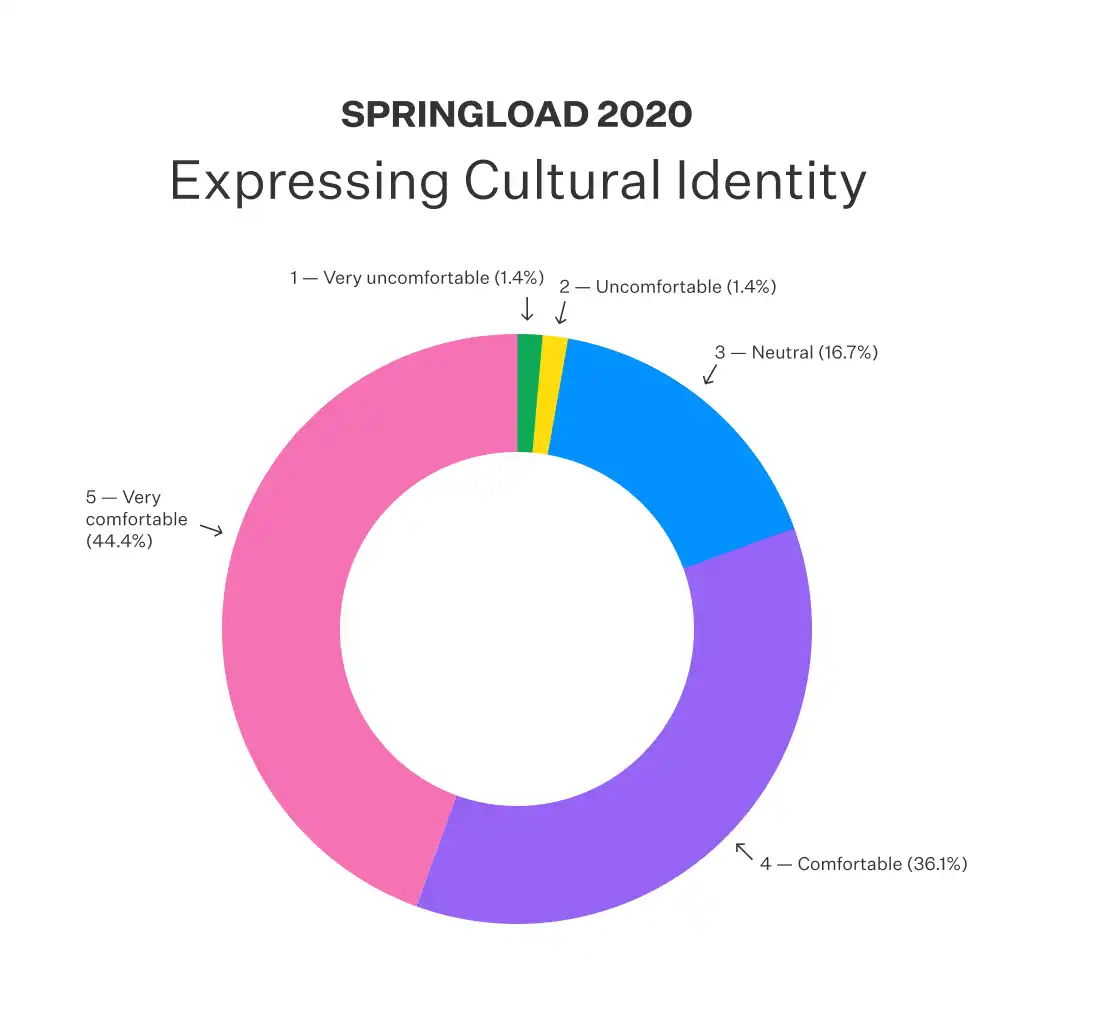
- How comfortable do you feel expressing your cultural identity at Springload?
This helped us gauge how respected, valued and comfortable our team feels at work. We followed up on all of these questions with an opportunity for the team to expand on their response, in order to deepen our understanding with qualitative feedback.
What we’ve achieved since last year
Encouraging diversity in the workplace is only part of the solution to creating equity. Making sure our people have adequate and appropriate support and can bring their whole selves to work is another key aspect.
Since last year, we’ve:
- created a rainbow community Slack channel where LGBTQIA+ members of the team can safely support and strengthen each other
- celebrated events like Pride by fundraising for local charities with a bake sale and movie screening
- encouraged our team to share traditions, causes and stories that are important to them, such as the Chinese Lunar New Year lunch and charities of the month
- added a noho marae into the induction process for each new team member, giving them the opportunity to explore and embrace te ao Māori and understand its importance.
Looking forward
We can see from these results that we’ve progressed from our initial survey last year, but there is still a long way to go before we are representative of the population of Aotearoa.
Our main focus this year and continuing into 2022 is increasing the representation of Māori and Pasifika in our team by offering learning opportunities for rangitahi Māori and building lasting relationships with Māori and Pasifika communities. We’d also like to continue building an inclusive culture by encouraging our team to share traditions, causes, and stories that are important to them.
We've just sent out our third annual survey, building on some of the learnings from 2020’s survey. It’s exciting to finesse the process as we learn and gauge how our team is feeling and where we can direct our energy.
If you’d like to have a kōrero about diversity and inclusion or you have any tips for us, please get in touch.
Get in touch
Let’s make the things that matter, better.
Email: hello@springload.co.nz
Phone: +64 4 801 8205